Overview of the extractive sector
Introduction
Greece is currently exploiting several mineral raw materials such as perlite, bentonite, magnesite, bauxite, gypsum, calcium carbonate (both from primary resources and marble residues), marble, mixed sulfide and nickeliferous ores. It preserves a high position globally and in Europe with regards to perlite, bentonite, magnesite, and bauxite (crude ore) production. In 2020 it ranked in lead position for perlite, bentonite, and crude bauxite production out of 3, 16 and 5 european producers respectively (Table 1.2-1).
Table 1.2-1: Mineral production – Ranking of Greece (Source: World Mining Data (WMD) reports 2017-2022)
| Group of commodities | Mineral | 2019 Global ranking | 2020 Global ranking | 2020 European ranking |
|---|---|---|---|---|
| Industrial Minerals | Perlite | 2 | 3/13 | 1/3 |
| Industrial Minerals | Bentonite | 5 | 5/47 | 1/16 |
| Industrial Minerals | Magnesite | 9 | 10/20 | 4/6 |
| Non-Ferrous metals | Bauxite (crude ore) | 15 | 13/30 | 1/5 |
| Mineral Fuels | Lignite | 11 | 13/29 | |
| Iron and Ferro-Alloy Metals | Chromium (Cr2O3 – Content) | 18 | 17/21 | 3/3 |
| Iron and Ferro-Alloy Metals | Nickel | 17 | 22/28 | 2/6 |
| Non-Ferrous metals | Lead | 28 | 25/47 | 6/15 |
| Precious metals | Silver (Precious metals) | 32 | 26/68 | 6/15 |
| Non-Ferrous metals | Aluminium | 28 | 28/40 | 7/13 |
| Industrial Minerals | Gypsum and Anhydrite | 31 | 28/78 | 9/22 |
| Non-Ferrous metals | Zinc | 35 | 34/54 | 8/15 |
| Industrial Minerals | Sulfur (elementar and industrial Sulfur) | 34 | 35/54 | 10/14 |
| Industrial Minerals | Salt | 57 | 58/101 | 14/21 |
| Precious metals | Gold (Precious metals) | 63 | 61/97 | 4/12 |
| Mineral Fuels | Petroleum | 81 | 84/102 | – |
| Mineral Fuels | Natural Gas | 91 | 91/93 | – |
The entrepreneurial activity of the sector is geographically distributed all over Greece. Most of the non-energy mining enterprises are operating in the Administrative Regions of Sterea Ellada, Central Macedonia and Macedonia-Thrace (central, north, and northeast Greece). The latter also gathers the core business (more than 80%) of marble producing companies while production of significant industrial minerals, such as bentonite and perlite prevails in the Administrative Region of South Aegean (Milos Island). The Administrative Regions of Western Macedonia in the northwest and Peloponnese in the south are the most important production centers of lignite.
The Greek extractive industry is a strongly export oriented industrial sector with a clear competitive advantage in certain market segments. According to a 2018 study conducted by the Foundation for Economic and Industrial Research (IOBE), the exports-to-sales ratio from 2010 to 2016 remains high with the exports value approaching the 50% of total sales (over 75% of total exported products). This ratio in 2016 is close to 90% for marbles and industrial minerals and around 75-80% for metallic minerals and metals. Based on the same study, the overall contribution of the extractive sector to the GDP is estimated to be 2,3% (3,9 billion euros). If energy production based on lignite is considered, the extractive sector’s contribution raises to 3,1% of GDP (5,4 billion euros) (https://www.sme.gr/wp-content/uploads/2019/09/symboli-tis-exoryktikis-biomihanias-ekthesi-2015-2017.pdf).
As acknowledged in the 2020 report ‘Development Plan for the Greek Economy’, conducted by the Christoforos Pissarides committee, a more complete verticalization and specialization of the production processes is needed, utilizing domestic mineral raw materials, to maximize the added value produced through the specific economic activity (https://government.gov.gr/schedio-anaptixis-gia-tin-elliniki-ikonomia/).
The National Recovery and Resilience Plan “Greece 2.0”, approved by ECOFIN on 13 July 2021, includes 106 investments and 68 reforms, utilizing investment resources of 31.16 billion euros, of which 30,5 billion European funds (18.43 billion euros in grants and 12.73 billion euros in loans) and will mobilize a total of 60 billion euros in investments in the country over the next five years (https://greece20.gov.gr/en/the-complete-plan/). According to the Association of Mining Enterprises (SME), the incorporation of the extractive sector’s activities in this plan is anticipated to mobilize significant investments that in turn may further boost exports.
The Extractive Industry in Greece is mainly represented by two major Associations, the Association of Mining Enterprises (SME), with 29 registered member companies (https://www.sme.gr/), and the Marble Industry Association of Macedonia – Thrace with more than 60 registered marble producing companies (https://www.semmth.gr/).
Production, exports and employment
A more detailed overview of the Country’s extractive sector in terms of production, exports, value of exports and employment variations is included in this section. The following sources were mainly used:
- Data processed and published by the Ministry of Environment and Energy in the annual reports of 2019 and 2020 (https://ypen.gov.gr/wp-content/uploads/2021/02/%CE%95%CE%9A%CE%98%CE%95%CE%A3%CE%97-2019-.pdf) and (https://ypen.gov.gr/wp-content/uploads/2022/07/%CE%95%CE%9A%CE%98%CE%95%CE%A3%CE%97-%CE%9F%CE%A0%CE%A5-2020.pdf);
- The World Mining Data (WMD) reports 2017-2022 (https://www.world-mining-data.info/?World_Mining_Data___PDF-Files)
- Data published by the Association of Mining Enterprises (SME) in the Activity Report 2020 Report-of-activities-2020.pdf (sme.gr), and
- The Sectoral Study Marble – Granites published by ICAP in 2021.
A snapshot of the current extractive sector’s status is given in SME’s Activity Report 2020 issued in 2021. Based on this report, 76.000 are estimated to be directly and indirectly employed in the sector. Employment presented a 10% reduction, as compared to the 2019 figure. The 2020 production of final commercial products was 63,2 Mt, reduced by 20% as compared to 2019. Finally, sales and exports in 2020 were 1,38 and 0,69 billion of euros respectively, both reduced by 30% as compared to the relevant 2019 figures. These variations were due to the severe shrinkage of lignite production (transition to other energy sources), the reduced Ferronickel production by LARCO GMMSA (the Greek nickel producer that was put under special administration and reduced production status), as well as the consequences of the COVID19 pandemic.
| 2020 | 2019 | Variation | |
| No of employees (direct % indirect job positions) | 76.000 | 85.000 | – 10% |
| Production of final products (Mt) | 63,2 | 79 | – 20% |
| Sales (billion euros) | 1,38 | 0,69 | – 30% |
| Exports (billion euros) | 0,69 | 0,99 | – 30% |
With regards to the member companies of the Association of Mining Enterprises (SME), 12.117 people were employed in both direct and indirect job positions in 2020 (-1,2% compared to 2019) and produced 47,2 Mt of final commercial products (-19% compared to 2019). During the same year, the sales, and exports in billion euros were 1,2 and 0,7 respectively (-25% and -20% compared to 2019). The observed drop-offs in 2020 as compared to 2019 are attributed by SME to the same reasons mentioned above Report-of-activities-2020.pdf (sme.gr).
Most of the marble producing companies and members of the Marble Industry Association of Macedonia – Thrace are in the wider area of Macedonia-Thrace in which 80% of the total Greek primary marble production takes place. 150 companies are active in the field employing around 6.000 people (in both direct and indirect job positions). The Administrative Region of Eastern Macedonia-Thrace hosts five (5) marble quarry centers with more than 135 quarries operating and covering over 90% of the country’s exports in quantity and value (https://www.semmth.gr/).
Based on WMD data, the mineral production figures for the years 2015 to 2020 are presented in Tables 1.2-2 and 1.2-3, by production in Metr.t and by value in Million USD respectively. Commodities are grouped in the following categories: Iron, Ferro – Alloys; Non-Ferrous metals; Precious metals; Industrial minerals; Mineral – Fuels; Bauxite (crude ore). These groups are further analyzed into specific commodities. Their production figures for the period 2015-2020 are presented in Table 1.2-4.
The Mineral-Fuels production corresponds mainly to lignite extraction which is in decline since 2015. This is not due to depletion of lignite resources. To combat climate change, Greece is aiming to gradual transition to other energy sources by 2028. As stated in WMD reports, metals’ mineral production figures do not refer to crude ore (ROM/run of mine) or concentrate produced from it (unless otherwise stated) but indicate the content of recoverable valuable elements and compounds.
Table 1.2-2: Total minerals production of Greece for the years 2015 to 2020, in Metr. t (Source: World Mining Data (WMD) reports 2017-2022)
| Group of commodities | 2015 | 2016 | 2017 | 2018 | 2019 | 2020 |
| Iron, Ferro – Alloys | 23.400 | 22.030 | 21.090 | 36.630 | 29.320 | 19.820 |
| Non-Ferrous metals | 204.795 | 211.829 | 204.657 | 224.325 | 224.043 | 229.707 |
| Bauxite (crude ore) | 1.831.660 | 1.847.700 | 1.927.150 | 1.559.359 | 1.379.123 | 1.428.631 |
| Precious metals | 27 | 30 | 24 | 38 | 40 | 52 |
| Industrial minerals | 3.323.037 | 3.323.580 | 3.384.372 | 3.852.440 | 3.487.058 | 3.394.213 |
| Mineral – Fuels | 46.383.969 | 32.855.476 | 37.948.551 | 36.785.746 | 27.555.680 | 13.947.700 |
| Total | 51.766.888 | 38.260.645 | 43.485.844 | 42.458.538 | 32.675.264 | 19.020.123 |
Table 1.2-3: Total minerals production of Greece for the years 2015 to 2020, by Value in Million USD (Source: World Mining Data (WMD) reports 2015-2022)
| Group of commodities | 2017 | 2018 | 2019 | 2020 | 2021 | 2022 |
| Iron, Ferro – Alloys | 278 | 211 | 220 | 443 | 353 | 191 |
| Non-Ferrous metals | 346 | 352 | 419 | 492 | 422 | 410 |
| Bauxite (crude ore) | 889 | 67 | 63 | 52 | 49 | 51 |
| Precious metals | 72 | 54 | 46 | 133 | 124 | 157 |
| Industrial minerals | 236 | 219 | 242 | 275 | 251 | 218 |
| Mineral – Fuels | 1.186 | 775 | 888 | 912 | 681 | 361 |
| Total | 3.007 | 1.678 | 1.878 | 2.307 | 1.880 | 1.388 |
Table 1.2-4: Commodities’ production in period 2015-2020 in Metr. t, unless otherwise stated (Source: World Mining Data (WMD) reports 2017-2022)
| Mineral Group / Mineral | 2015 | 2016 | 2017 | 2018 | 2019 | 2020 | |
| Iron and Ferro-Alloy Metals | |||||||
| Chromium (Cr2O3 – Content) | 0 | 16.650 | 12.080 | 12.000 | |||
| Nickel (Ni) | 21.060 | 22.030 | 21.090 | 19.980 | 17.240 | 7.820 | |
| Non-Ferrous metals | |||||||
| Aluminium (Al, primary) | 179.420 | 181.680 | 181.700 | 187.465 | 186.903 | 181.900 | |
| Bauxite (crude ore) | 1.831.660 | 1.847.700 | 1.927.150 | 1.559.359 | 1.379.123 | 1.428.631 | |
| Lead (Pb) | 10.074 | 11.283 | 12.075 | 15.345 | 14.818 | 19.717 | |
| Zinc (Zn) | 13.174 | 18.866 | 18.715 | 21.515 | 22.322 | 28.090 | |
| Precious metals | |||||||
| Gold (Au) in kg | 1.600 | 940 | 823 | 2.839 | 2.333 | 2.177 | |
| Silver (Ag) in kg | 28.050 | 29.342 | 34.220 | 39.150 | 37.790 | 50.301 | |
| Industrial Minerals | |||||||
| Bentonite | 1.123.320 | 883.220 | 1.087.800 | 1.365.374 | 1.393.958 | 1.170.000 | |
| Gypsum and Anhydrite | 649.280 | 777.990 | 547.140 | 827.298 | 589.012 | 780.000 | |
| Magnesite | 383.230 | 397.940 | 442.680 | 425.882 | 358.841 | 360.000 | |
| Perlite | 890.670 | 921.410 | 932.950 | 790.412 | 718.077 | 718.000 | |
| Salt | 121.537 | 158.020 | 166.527 | 163.474 | 167.170 | 156.213 | |
| Sulfur (elemental and industrial S) | 155.000 | 185.000 | 210.000 | 280.000 | 260.000 | 210.000 | |
| Mineral Fuels | |||||||
| Lignite | 46.308.120 | 32.674.790 | 37.802.600 | 36.574.360 | 27.383.575 | 13.851.400 | |
| Natural Gas (in Millions of m3) (1 m3 ≈ 0.8 kg = 0.0008 metr. t) |
4 | 9 | 8 | 12 | 9 | 6 | |
| Petroleum | 72.649 | 173.486 | 139.551 | 201.786 | 164.905 | 91.500 | |
| Total (in Metr. t) | 51.762.424 | 38.260.645 | 43.496.413 | 42.458.542 | 32.675.264 | 19.020.123 | |
In 2020, a decline in production of Iron, Ferro – Alloys group is observed, compared to the average production in the preceding years. The production of non-ferrous metals remains stable for the same period while their slight production increase from 2018 onwards may be attributed to the substantial increase of mixed sulfides production. The bauxite production declines slightly from 2018 onwards compared to figures of the preceding three years period (Table 1.2-4).
Additionally, the production of
(as legally classified in the Greek Mining Code) and processed products is presented in Table 1.2-5, based on data published by the Ministry of Energy and Environment (YPEN) in their annual reports (reference year 2020).
Table 1.2-5: Production of processed Metallic Minerals or Ores during the period 2016-2020, in Metric t., unless otherwise stated (Source: Mining and Quarrying Activity in Greece, YPEN Annual Report 2020)
| Mineral and mineral product | 2016 | 2017 | 2018 | 2019 | 2020 |
| Bauxite (crude ore) | 1.847.700 | 1.927.150 | 1.559.359 | 1.379.123 | 1.428.639 |
| Alumina (hydrated) | 820.800 | 821.000 | 827.000 | 820.100 | 826.500 |
| Alumina (calcined) | 693.460 | 695.400 | 648.436 | 664.728 | 672.527 |
| Aluminium,primary(foundry line) | 181.680 | 181.700 | 187.465 | 186.903 | 189.036 |
| Chromite (crude ore) | 0 | 34.690 | 25.171 | 1.651 | |
| Emery | 7.150 | 5.520 | n/a | 7.150 | 7.150 |
| Huntite (crude ore) | 23.220 | 13.500 | 12.600 | 17.600 | 18.980 |
| Magnesite (crude ore) | 397.940 | 442.680 | 425.882 | 358.841 | 335.943 |
| Dead-burned magnesia | 20.840 | 21.860 | 22.784 | 24.441 | 34.327 |
| Caustic calcined magnesia | 89.780 | 119.400 | 112.114 | 83.841 | 96.640 |
| Basic monolithic refractories | 42.090 | 47.380 | 60.487 | 51.422 | 44.207 |
| Mixed sulfide ores (crude ore) | 184.970 | 291.980 | 396.000 | 405.010 | 627.766 |
| Lead concentrate (PbS) | 14.280 | 15.530 | 24.592 | 22.676 | 30.552 |
| Zinc concentrate (ZnS) | 34.110 | 33.220 | 43.821 | 44.241 | 55.698 |
| Auriferous arsenopyrite concentrate (FeS2) | n/a | 37.300 | 91.340 | 75.167 | 110.621 |
| Nickeliferous ores (laterites – crude ore) | 2.448.070 | 2.343.260 | 2.220.211 | 1.915.514 | 1.030.434 |
| Ferronickel (FeNi) | 87.880 | 86.140 | 82.615 | 60.187 | 29.263 |
| Ni content of ferronickel | 17.070 | 16.780 | 15.720 | 11.604 | 5.774 |
| Electric furnace slag (byproduct) | 1.907.160 | 2.076.100 | 1.989.340 | n/a | n/a |
| OBM converters slag (byproduct) | 83.660 | n/a | n/a | n/a | n/a |
Metallic Minerals or Ores’ production in 2020 presents noticeable fluctuations. Production of mixed sulfides shows an increase of 55% while domestic production of lignite and laterites shows a decrease of 50% and 46% respectively as compared to 2019 figures. Extraction of bauxite and production of alumina and aluminum products shows a relative minor increase (Table 1.2-5).
The production of
for the period 2016-2020 is presented in Tables 1.2-6, 1.2-7 and 1.2-8. Industrial minerals’ production is relatively stable except for ceramic grade clays, calcium carbonate and pozzolan (Table 1.2-6). Nevertheless, a decrease of 30% in bentonite and marble blocks production is observed in 2020 compared to 2019 figures (Tables 1.2-6 & 1.2-7). Aggregates’ production shows a slight increase of 10% in 2020 compared to 2019 (Table 1.2-8).
Table 1.2-6: Industrial minerals production during the period 2016-2020, in Metric t., unless otherwise stated (Source: Mining and Quarrying Activity in Greece, YPEN Annual Report 2019 and 2020)
| Mineral and mineral product | 2016 | 2017 | 2018 | 2019 | 2020 |
| Amphibolite | 36.060 | 37.760 | 49.463 | 53.997 | 38.673 |
| Attapulgite | 44.720 | 54.280 | 53.400 | 10.160 | 13.950 |
| Clays for the cement industry | 1.371.710 | 1.435.780 | 1.266.891 | 1.196.660 | 1.107.120 |
| Ceramic grade clays | 231.850 | 640.870 | 776.261 | 914.074 | 969.857 |
| Calcium Carbonate | 202.530 | 129.610 | 140.101 | 158.485 | 160.196 |
| Bentonite | 883.220 | 1.087.800 | 1.365.374 | 1.393.958 | 973.329 |
| Bentonite (partially processed) | 787.180 | n/a | n/a | n/a | n/a |
| Bentonite (processed) | 682.590 | n/a | n/a | n/a | n/a |
| Hornstone | 70.922 | n/a | 78.669 | 107.247 | 125.414 |
| Gypsum | 777.990 | 547.140 | 827.298 | 589.012 | 622.834 |
| Olivine | 24.890 | 22.250 | 29.071 | 21.205 | 7.825 |
| Perlite | 921.410 | 932.950 | 790.412 | 718.077 | 821.233 |
| Perlite (partly processed) | 499.320 | n/a | n/a | n/a | n/a |
| Perlite (processed) | 396.840 | n/a | n/a | n/a | n/a |
| Pozzolan (Santorin earth) | 117.010 | 17.400 | 46.080 | 62.633 | 72.443 |
| Pumice | 658.880 | 971.160 | 842.355 | 701.143 | 923.927 |
| Quartz & Quartzite | 5.070 | 80.720 | 71.971 | n/a | |
| Salt | 158.020 | 166.527 | 163.474 | 167.170 | n/a |
| Silica | 141.550 | n/a | 79.500 | 67.600 | n/a |
| Volcanic tuff | 80.100 | n/a | |||
| Zeolite | 110 | 2.454 | 873 | 537 | 739 |
Table 1.2-7: Marble production, exports, and value of exports during the period 2015-2020 (Source: Sectoral study Marble – Granites, ICAP, 2021)
| 2015 | 2016 | 2017 | 2018 | 2019 | 2020 | |
| Marble blocks production in m3 | 500.000 | 540.000 | 645.000 | 585.000 | 640.000 | 500.000 |
| Marble production in tons | 1.350.000 | 1.458.000 | 1.741.500 | 1.579.500 | 1.728.000 | 1.350.000 |
| Production of finished products in m2 | 5.160.000 | 5.332.000 | 6.364.000 | 5.762.000 | 6.192.000 | 5.000.000 |
| Exports (tons) | 760.000 | 816.834 | 1.147.696 | 1.116.607 | 1.057.732 | 821.156 |
| Value of exports (€) | 259.469.107 | 292.457.630 | 411.962.479 | 441.278.861 | 400.962.525 | 294.544.051 |
| Marble sector’s share in total exports (%) | 1,41 | 1,57 | 2,06 | 1,99 | 1,72 | 1,22 |
Table 1.2-8: Aggregates production during the period 2016-2020, in Metric t., unless otherwise stated (Source: Mining and Quarrying Activity in Greece, YPEN Annual Report 2020)
| Type of aggregate | 2016 | 2017 | 2018 | 2019 | 2020 |
| Limestone aggregates (crushed rock, sand & gravel) | 42.051.690 | 38.339.770 | 34.439.069 | 36.998.272 | 40.861.290 |
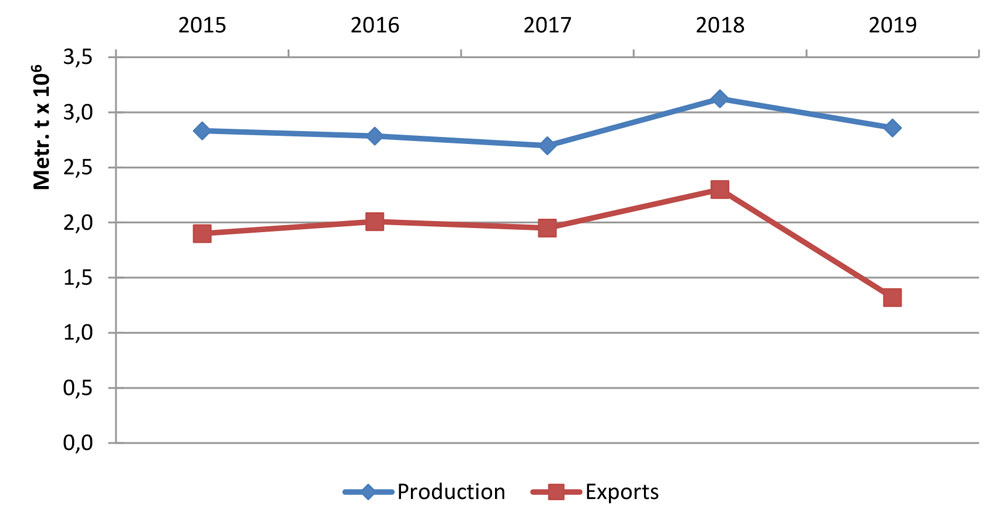
As already mentioned, the industrial minerals and marble sectors are strongly export-oriented. The export fluctuations over a 5 years’ period for four significant domestically produced industrial minerals are presented in Fig. 1.2-1.
Fig.1.2-1: Production-exports of four industrial minerals (perlite, bentonite, gypsum, and calcium carbonate) for 2015-2019 (Source: Mining and Quarrying Activity in Greece, YPEN Annual Report 2019)
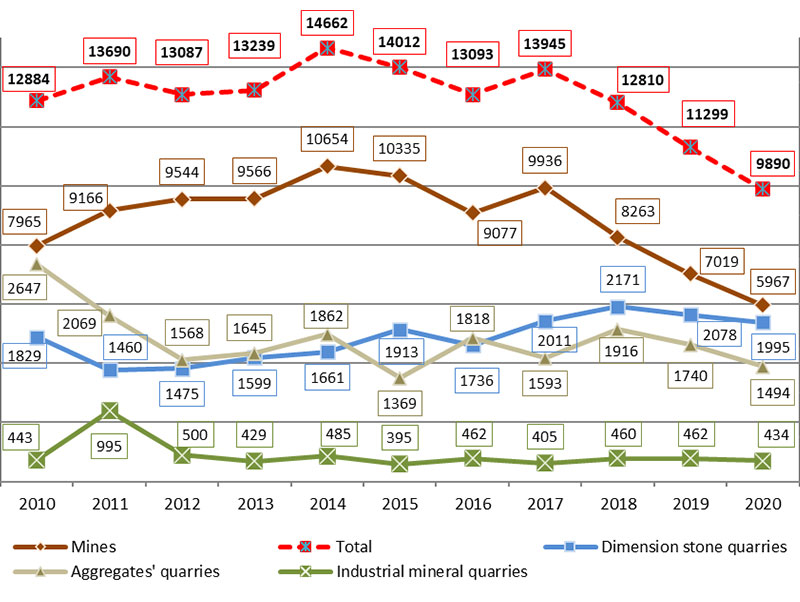
With regards to employment, the variation of the extractive’s sector workforce from 2010 to 2020 per mineral category is shown in Fig. 1.2-2. The number of employees in the mining sector since 2014 decreases steadily except of the observed slight increase from 2016 to 2017. In 2020 we observe a further decrease of 12,5% compared to previous year. This decrease is attributed to the consequences of COVID19 pandemic and shrinkage of lignite production. Fluctuations are observed in the marble and aggregate producing quarries while the relevant numbers in the industrial minerals sector remain quite stable since 2012.
Fig.1.2-2: Variation of the workforce directly employed in the extractive sector in 2010-2020 (number of persons per year) (Source: Mining and Quarrying Activity in Greece, YPEN Annual Report 2020)